Routine Analysis
Routine Analysis is Signals' core feature that provides deployment confidence by understanding your team's established deployment patterns. Instead of treating all changes equally, it learns what "normal" looks like for your infrastructure and flags when something breaks from routine.
How Routine Analysis Works
Pattern Detection
Routine Analysis uses advanced statistical methods to identify genuine behavioural patterns in your deployment history. Rather than simple frequency counting, it detects stable periods of consistent deployment behavior and automatically identifies when patterns change significantly.
What it analyses:
- Modification frequency over time for each resource and component
- Stable deployment periods vs. behavioral shifts
- Team-specific deployment rhythms and cycles
- Component-level change patterns within resources
What you see:
- Precise timing context: "2 events/day for the last 1 week and 1 day"
- Behavioral descriptions: "Consistent routine deployments with 15.4 events/day for the last 2 weeks and 3 days"
- Pattern breaks: "First time changing this attribute"
Routine Analysis adapts to your changing deployment patterns over time:
- Established patterns gradually incorporate new behaviors
- Seasonal changes (holidays, release cycles) are automatically detected
- Configuration adjustments help the system learn your team's evolving practices
Scoring Logic
Routine Analysis contributes to the overall -5 to +5 signal score based on how your current changes compare to established patterns:
- Positive scores (+1 to +5): Changes that follow well-established, frequent deployment patterns
- Neutral scores (0): Changes within normal variation ranges for your team
- Negative scores (-1 to -5): First-time changes, infrequent modifications, or pattern breaks
The more established and consistent a pattern, the higher the confidence boost when you follow it.
Configuration
Accessing Routine Configuration

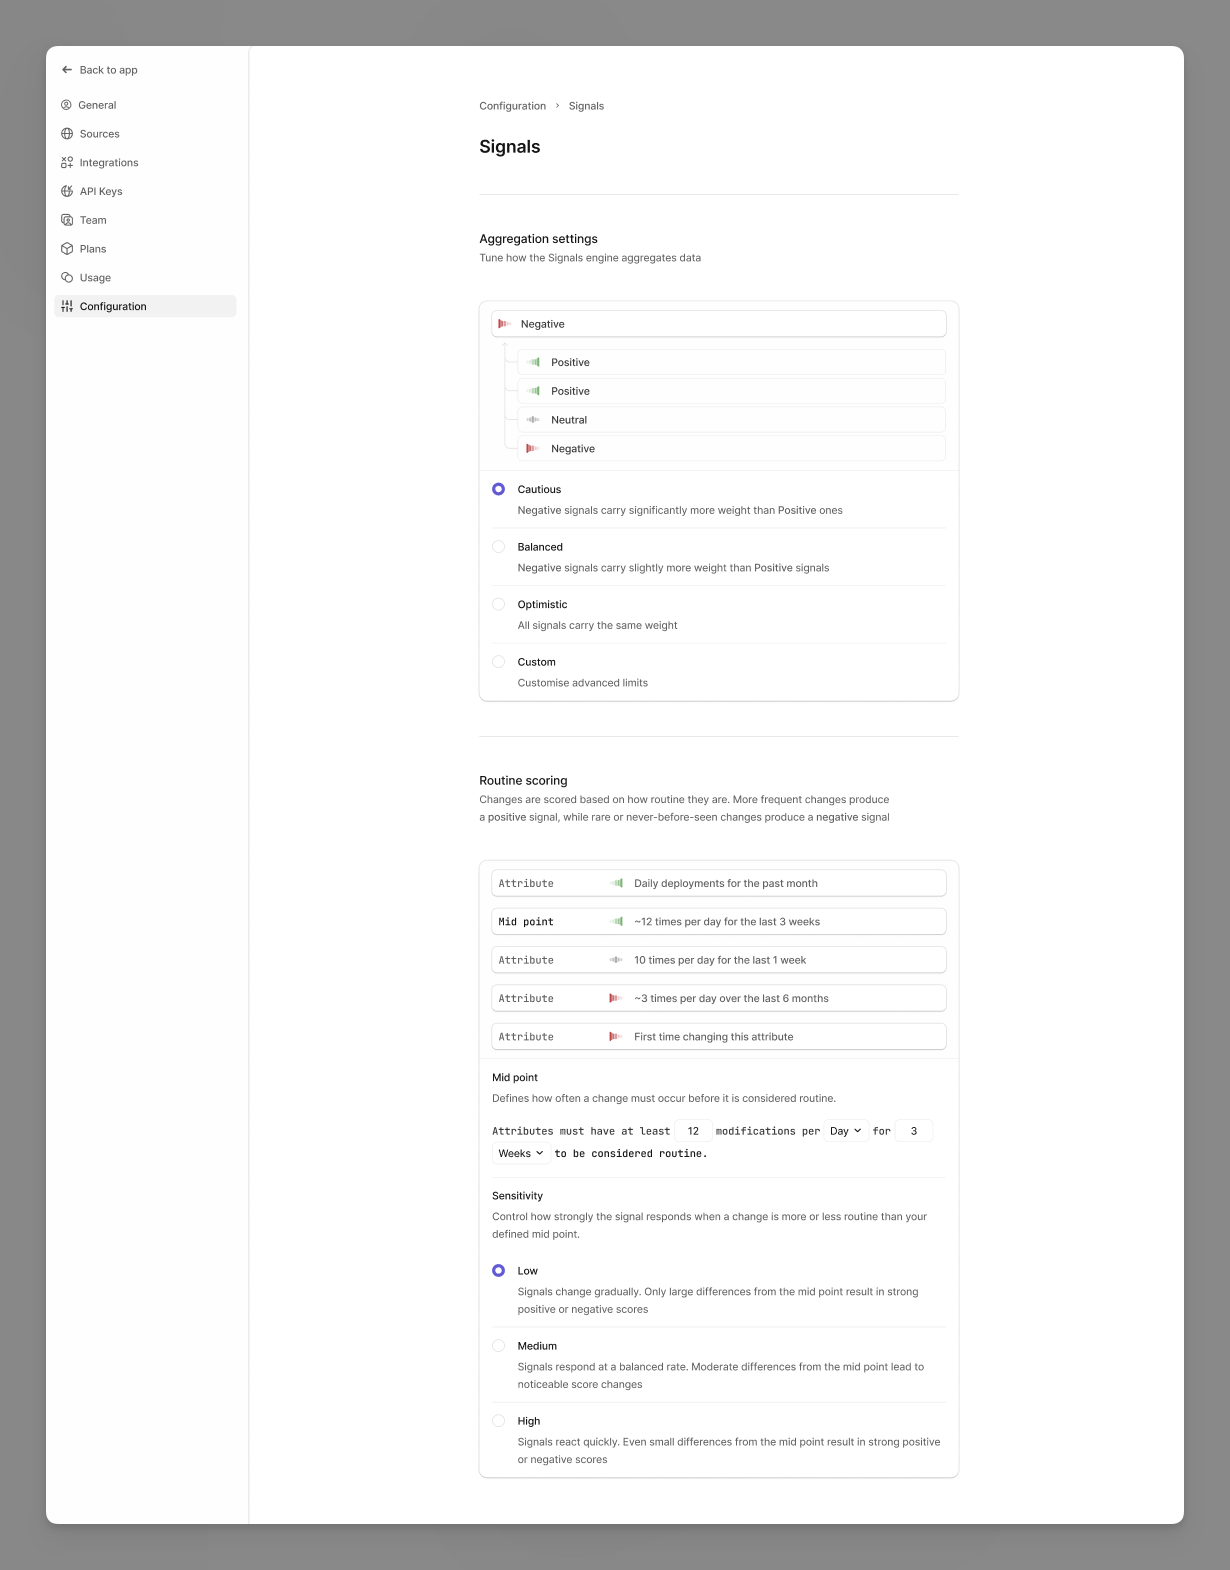
Navigate to Configuration > Signals in your workspace settings and then scroll down to the 'Routine Scoring' section. This section is specefic to Routine configuration.
Midpoint Settings

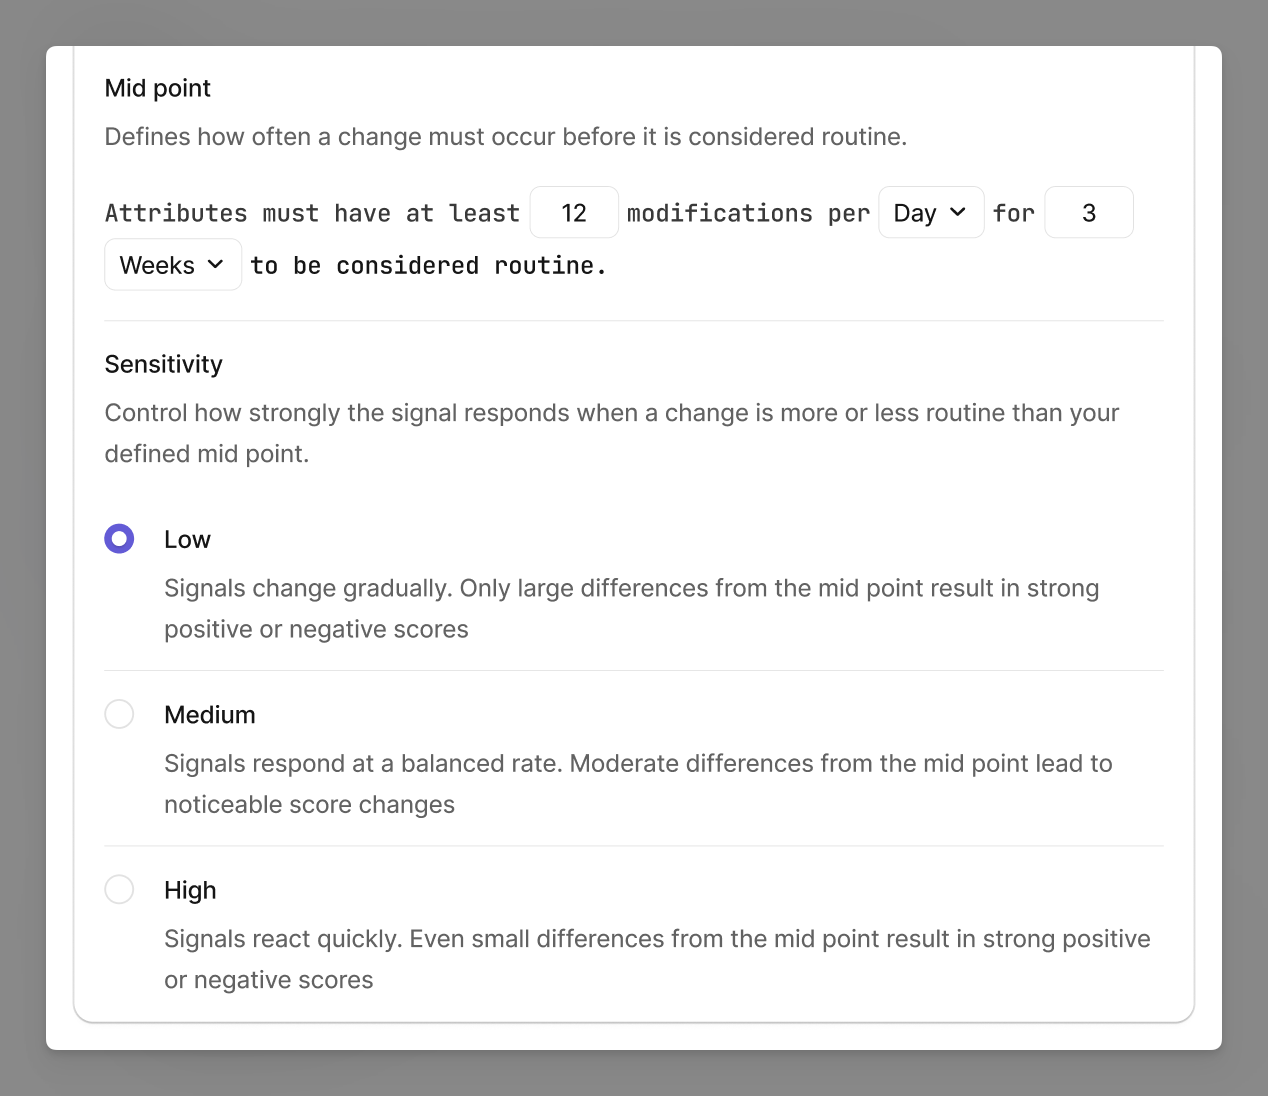
The midpoint defines the threshold between positive and negative routine signals for your team.
Format: "X changes per [time period] for Y [duration]"
- Frequency: How often changes occur (e.g., "12 changes per day")
- Duration: How long this pattern should persist (e.g., "for 3 weeks")
- Complete example: "12 changes per day for 3 weeks"
How it works
- Changes more frequent than your midpoint → positive routine signals
- Changes less frequent than your midpoint → negative routine signals
- First-time changes → negative signals (no pattern exists)
Sensitivity Control
Adjust how strongly Routine Analysis responds to deviations from your midpoint:
Low Sensitivity
- Gradual signal changes
- Only major deviations from your midpoint produce strong positive or negative scores
- Best for: Stable teams with very predictable deployment cycles
Medium Sensitivity (Default)
- Balanced response to pattern changes
- Moderate deviations from your midpoint produce noticeable signal changes
- Best for: Most teams with regular but somewhat variable deployment patterns
High Sensitivity
- Quick signal response to frequency changes
- Small deviations from your midpoint produce strong positive or negative signals
- Best for: Teams where small changes in deployment frequency are operationally significant
Reading Routine Analysis
In the Signals Interface

Change-Level Routine Summary:
Located in the top section, provides an overview like:
- "Recent infrastructure changes span multiple attributes, with modification frequencies ranging from first-time updates to daily deployments"
Resource-Level Routine Analysis:
Found in the Resources section, showing patterns for individual components:
- Expandable resources reveal component-level analysis
- Each component shows its own routine pattern
- Historical context helps understand current changes
Component-Level Insights
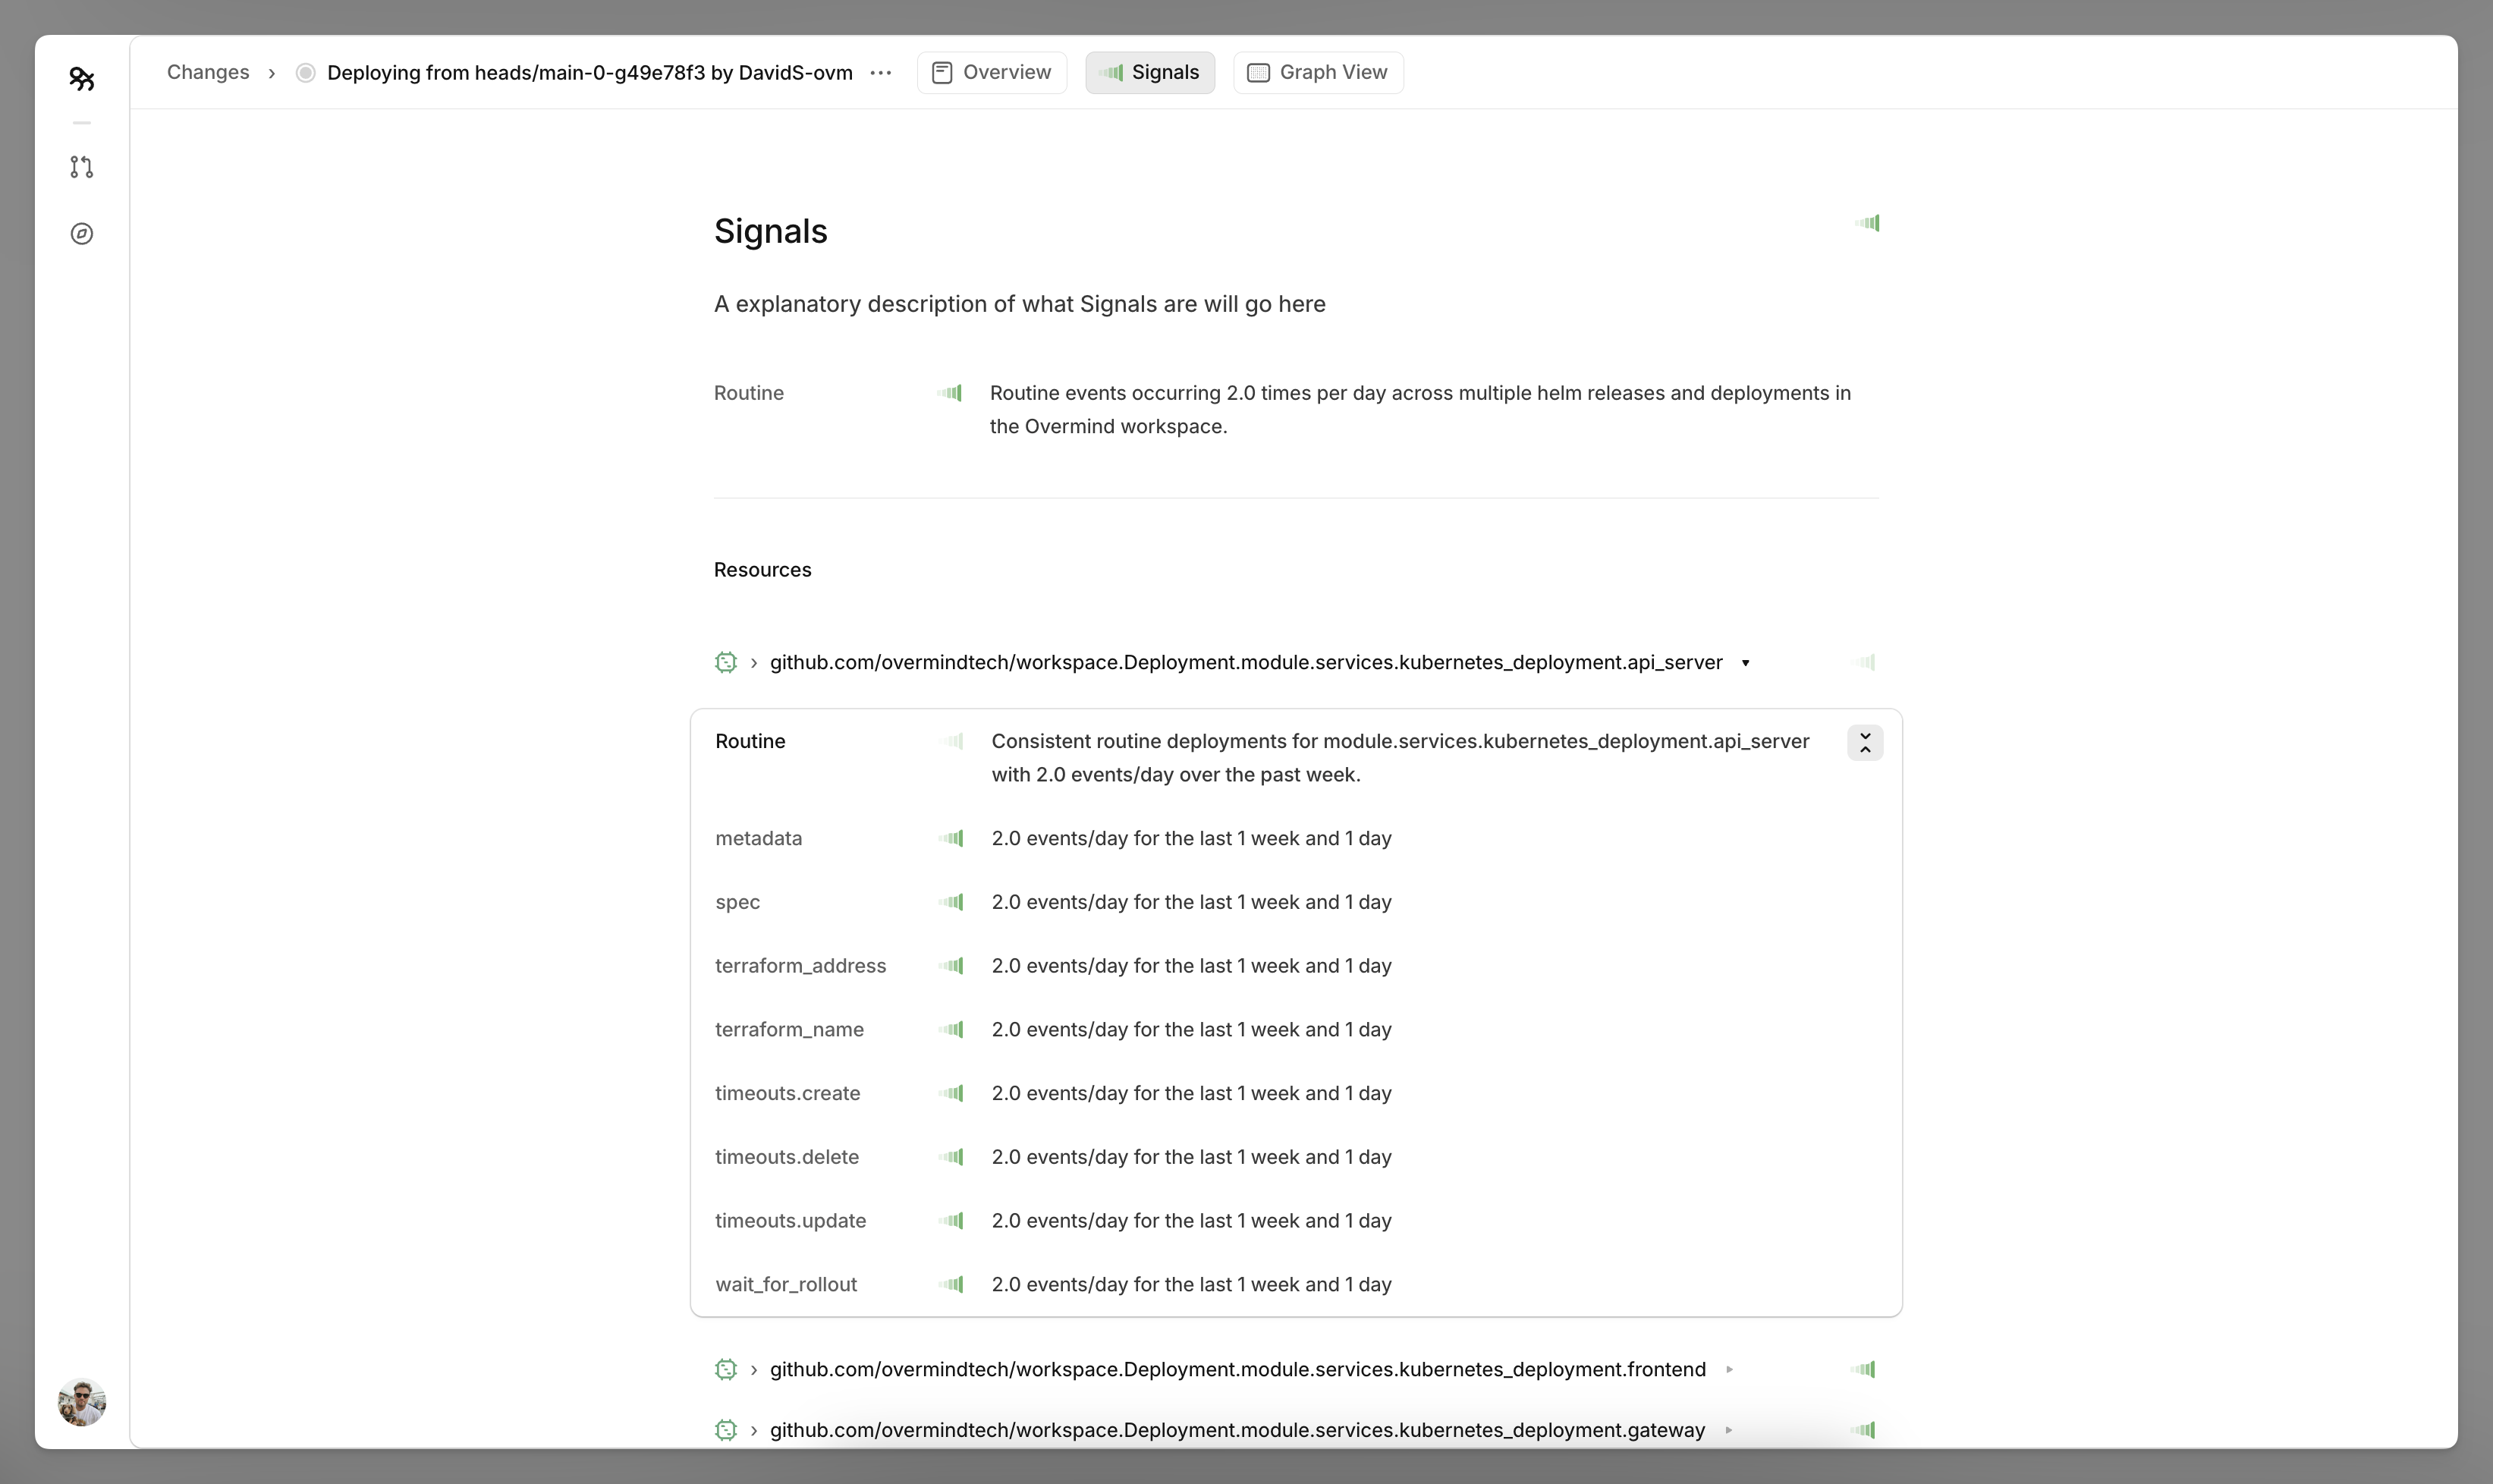
When you expand a resource like github.com/overmindtech/workspace.Deployment.module.services.kubernetes_deployment.api_server, you'll see routine analysis for each component:
Routine: Consistent routine deployments for module.services.kubernetes_deployment.api_server
with 2.0 events/day over the past week.

Component Analysis:
├── metadata: 2.0 events/day for the last 1 week and 1 day
├── spec: 2.0 events/day for the last 1 week and 1 day
├── terraform_address: 2.0 events/day for the last 1 week and 1 day
└── timeouts.update: 2.0 events/day for the last 1 week and 1 day
Interpreting Patterns
Strong Positive Signals:
- Components showing consistent, frequent deployment patterns
- Well-established modification cycles that match your team's rhythm
- Changes that align with your configured midpoint or exceed it
Attention-Required Signals:
- "First time changing this attribute" - no historical pattern exists
- Infrequent modifications that fall below your midpoint threshold
- Components breaking from established deployment routines
Mixed Signals:
- Some components routine while others exceptional within the same resource
- Requires component-level review to understand specific areas of concern
- Common in complex resources with different change frequencies per component
Best Practices
Setting Your Midpoint
- Analyse your actual patterns: Review several weeks of deployment history before setting your midpoint
- Account for team cycles: Consider sprint schedules, maintenance windows, and release cycles
- Start conservative: Begin with a midpoint that reflects your typical busy periods, not peak deployment days
Sensitivity Tuning
- Start with Medium: Most teams benefit from the default medium sensitivity
- Adjust based on feedback: If signals don't match your team's risk intuition, try different sensitivity levels
- Consider your environment: Production deployments might warrant higher sensitivity to pattern changes
- Monitor over time: Sensitivity needs may change as your deployment practices evolve
Workflow Integration
During PR Review:
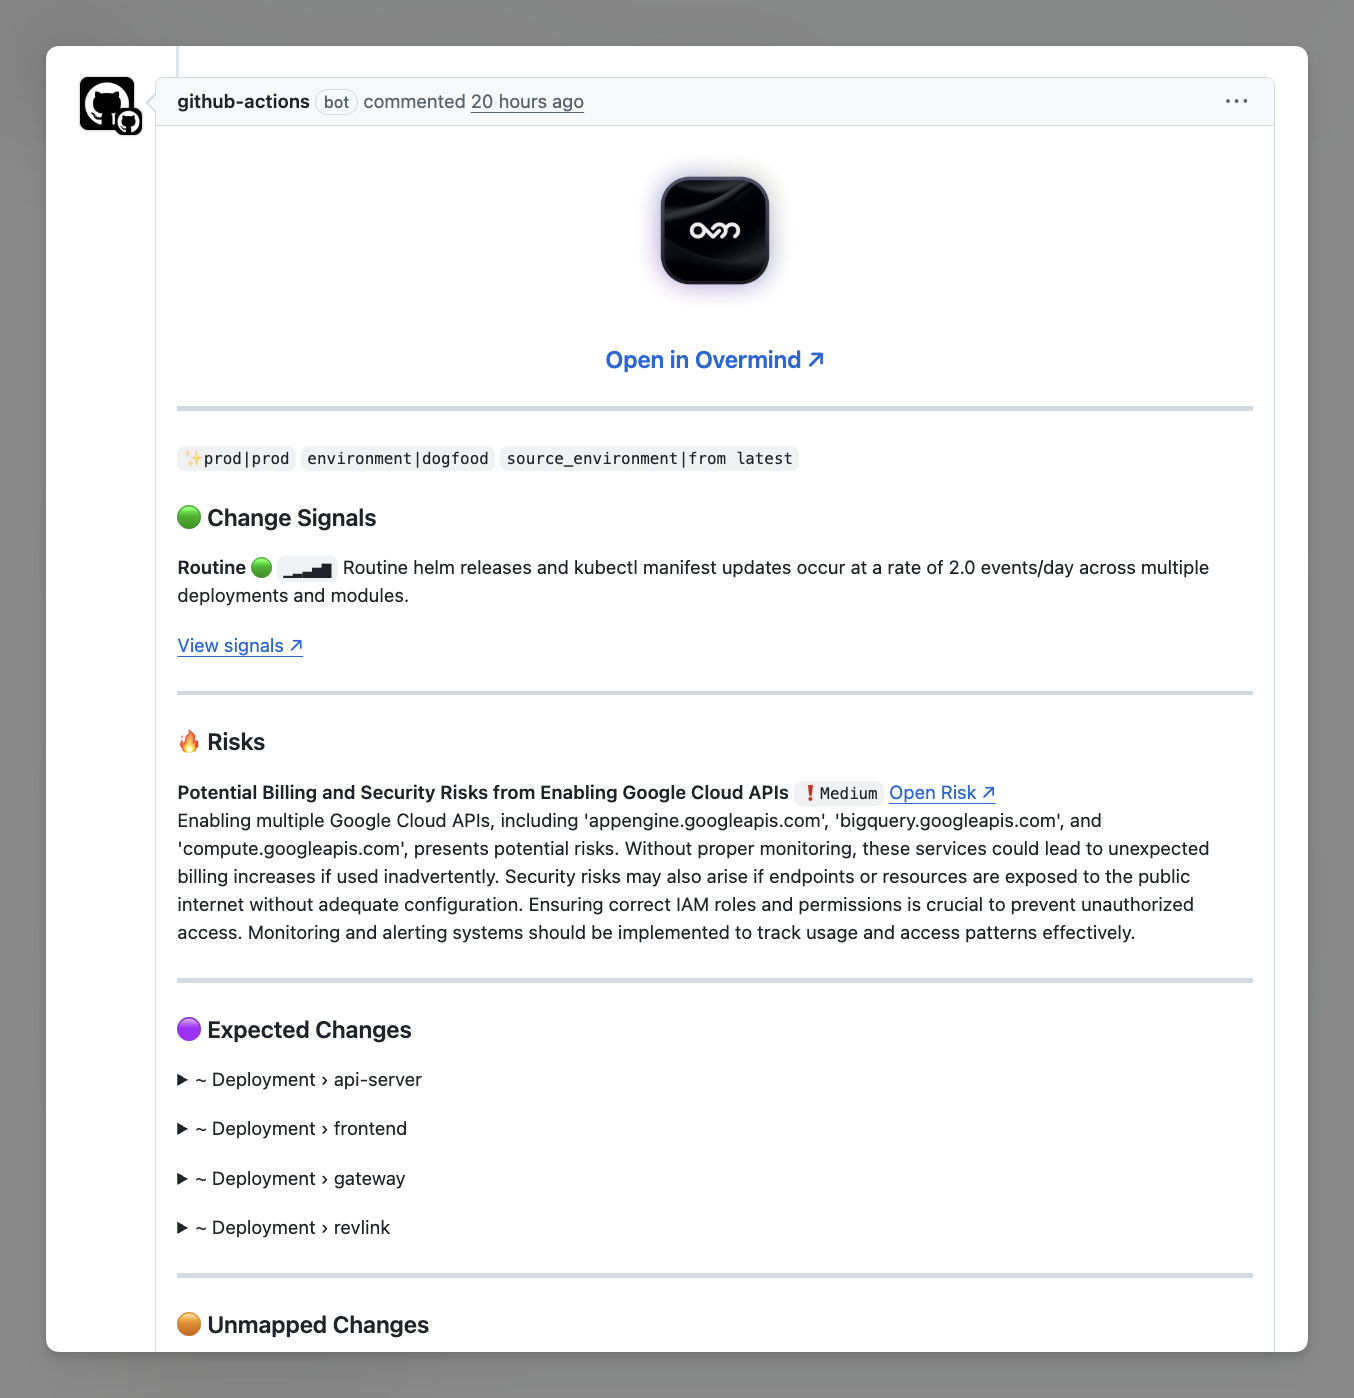
- Pay attention to routine analysis summaries in PR comments
- Use "View Signals" for detailed component-level analysis when patterns are mixed
- Consider routine confidence alongside other risk factors

For Deployment Decisions:
- High routine confidence can increase deployment velocity
- First-time changes deserve extra validation even if other signals are positive
- Use component-level analysis to focus review time on exceptional changes
Team Calibration:
- Regularly review whether routine signals align with team risk assessment
- Adjust configuration as deployment patterns evolve
- Share configuration decisions with team members for consistent interpretation
Troubleshooting
Routine signals don't match expectations:
- Check your midpoint setting - it may not reflect your actual deployment patterns
- Consider adjusting sensitivity if signals are too aggressive or too lenient
All changes showing as "first time":
- New infrastructure or resources need time to establish patterns
- Ensure sufficient deployment history exists (typically 2-3 weeks minimum)
- Check that your monitoring period isn't too restrictive
Inconsistent component-level analysis:
- Different components naturally have different change frequencies
- Focus on components showing unexpected patterns rather than expecting uniformity
- Some resources have naturally mixed routine vs. exceptional components
For questions about Routine Analysis configuration or interpretation, visit our support documentation or join our Discord community.