What are Signals?
Signals is an Overmind feature that builds deployment confidence by analyzing patterns in your infrastructure changes. Instead of simply flagging what's changing and the associated risks, Signals determines whether your changes are actually safe to deploy by examining historical patterns and current context. In essence, it captures and operationalizes all that organizational and change-specific tribal knowledge that typically lives only in your team's collective memory.
When you create a change in Overmind, Signals automatically analyses your infrastructure modifications and provides insights that help teams make informed deployment decisions.
Types of Signals
In Overmind there are two different types of signals:
Change-Level Signals
These signals analyse your entire deployment as a whole and appear in the top section of the Signals page. Some examples of change-level signals could be:
- Routine Analysis: "Recent infrastructure changes span multiple attributes, with modification frequencies ranging from first-time updates to daily deployments"
- GitHub App Signals: Pulls deployment timing, branch hygiene, and automation health from your connected repositories. Learn more
- Blast Radius: "200 items" affected by your change (coming soon)
- Environment Context: "Production" environment detection (coming soon)
- Timing Intelligence: "Peak hours, 9 AM - 5 PM" (coming soon)
- Custom Signals: Team-submitted signals like "Database migration required - Manual review needed"
Resource-Level Signals
These signals analyse individual resources and appear in the Resources section, for example:
- Routine Analysis: Shows change patterns for specific attributes for each resource. Allowing a user to see which attributes are changed frequently, and which are uncommon.
- Change Type: "High risk", "First time changing" indicators for individual resources (coming soon)
- Policy Compliance: "Security group allows 0.0.0.0/0 on port 22" (coming soon)
Currently, Routine Analysis is fully available at both levels, with other signal types in development.
How Signals Works
Signals uses a scoring system from -5 to +5, where:
- -5 : Extremely Negative
- -4 : Very Negative
- -3 : Negative
- -2 : Moderately Negative
- -1 : Slightly Negative
- 0 : Neutral
- +1 : Slightly Positive
- +2 : Moderately Positive
- +3 : Positive
- +4 : Very Positive
- +5 : Extremely Positive

Available Signals
Routine Analysis
Signals analyses the historical modification patterns of your infrastructure to determine how routine or exceptional your current changes are. Using advanced statistical analysis, it detects genuine behavioral patterns in your deployment history rather than just simple averages.
What it does:
- Examines modification frequency over time for each resource
- Automatically detects stable periods of consistent deployment behavior
- Identifies when deployment patterns change significantly
- Provides precise context like "2 events/day for the last 1 week and 1 day" or "15 events/day for the last 2 weeks and 3 days"
How it interprets patterns:
- Frequent, consistent changes → Positive signals (well-established deployment patterns)
- Infrequent or first-time changes → Negative signals (require additional attention)
- Pattern breaks → Flags when current changes deviate from established routines
You can learn more about how routine analysis works in detail in the Routine Signal documentation.
Custom Signals
Custom Signals allow teams to programmatically add organizational knowledge and context-specific insights to their changes. These signals capture tribal knowledge, compliance requirements, and team-specific deployment criteria that automated analysis might miss.
What Custom Signals do:
- Encode team-specific deployment knowledge into changes
- Add context about environment, timing, or business impact
- Integrate compliance and approval workflows
- Provide custom scoring based on organizational criteria
Basic usage:
overmind changes submit-signal \
  --title 'Environment' \
  --description 'Change made in PROD' \
  --value -2 \
  --ticket-link "$PR_URL"
Custom Signals use the same -5 to +5 scoring system and appear alongside routine analysis in your change overview.
For complete implementation details, CI/CD integration examples, and best practices, see the Custom Signals Guide.
Accessing Signals
In Your Pull Request
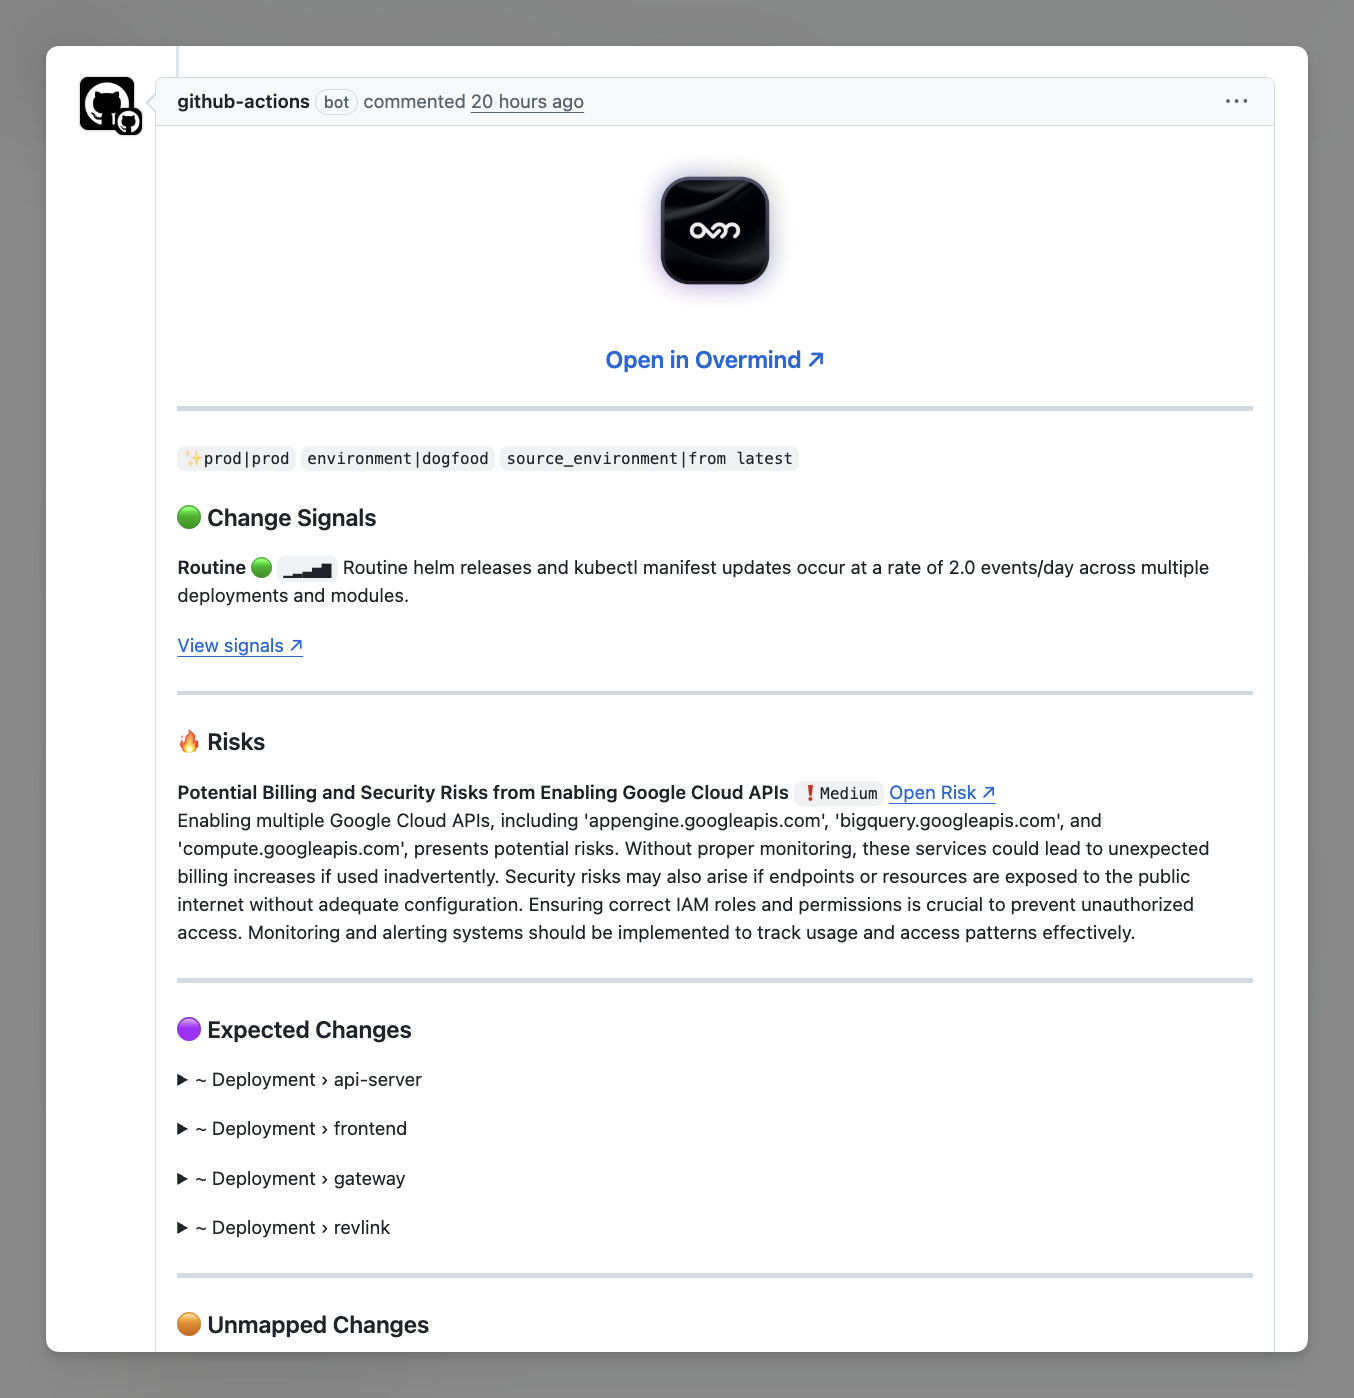
When using Overmind's GitHub Action integration, you'll see a Signals summary directly in your PR comments with a quick confidence assessment and "View Signals" link for detailed analysis.
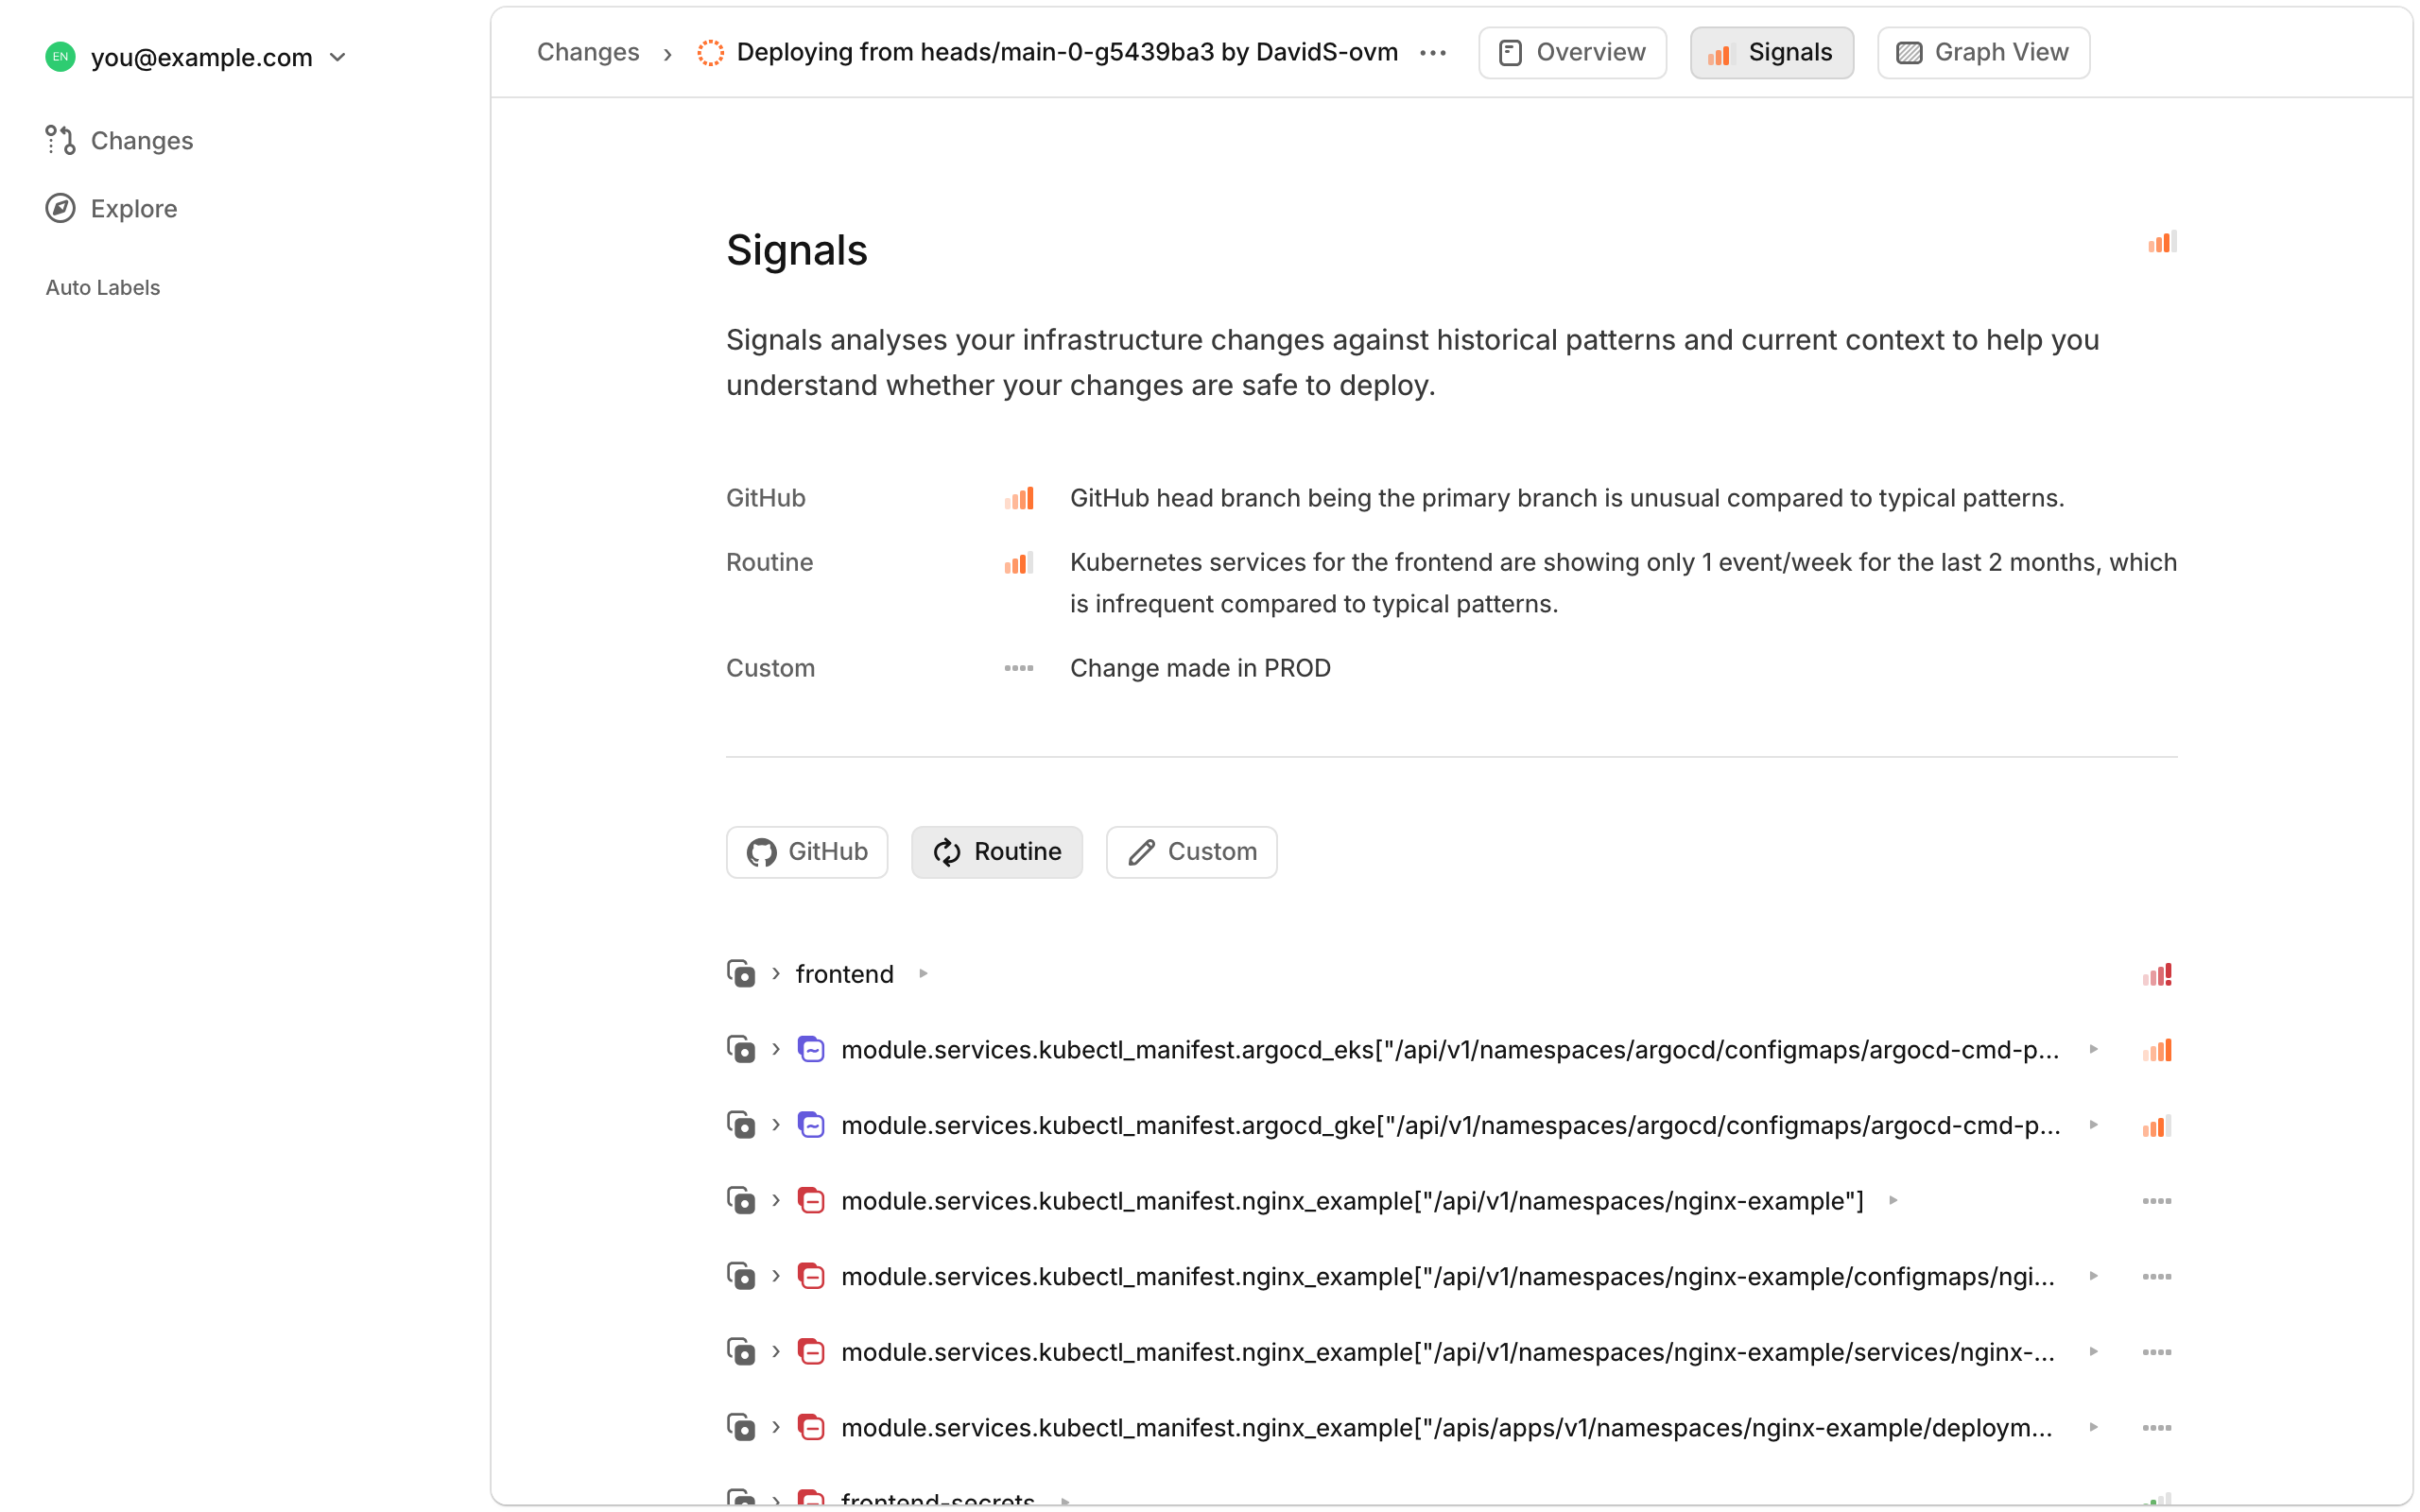
Signals Page Interface
Navigate to the Signals tab in your change to see the full analysis interface, which is organized into two main sections:
Top Section - Change-Level Overview
- Routine: "Recent infrastructure changes span multiple attributes, with modification frequencies ranging from first-time updates to daily deployments"
- Custom Signals: Team-submitted signals with organizational context
Bottom Section - Resources
Individual resources are listed with confidence indicators and can be expanded for detailed analysis:
- Click any resource (like
api-server-natsorgateway) to see component-level breakdown - Each expanded resource shows routine analysis for components like
metadata,spec,terraform_address - Historical patterns displayed as "2.0 events/day for the last 1 week and 1 day"
Interpreting Signals
Visual Indicators
The Signals interface uses clear visual cues:
- Green indicators (🟢): Positive confidence - routine, established patterns
- Red indicators (🔴): High attention needed - first-time changes or risk factors
- Gray indicators (⚪): Neutral baseline signals
Reading Your Analysis
High Confidence Deployments:
- Most resources show green indicators with consistent patterns
- Example: "Consistent routine deployments with 2.0 events/day over the past three weeks"
Attention Required:
- Red indicators on resources or components
- "First time changing this attribute" messages
- "High risk" change type classifications
Component-Level Insights:
- Expand any resource to see which specific parts are routine vs. exceptional
- Different components may have different confidence levels
- Focus review time on components showing red indicators or first-time changes
Best Practices
For Development Teams
Review Process:
- Use Signals as input for deployment decisions, not absolute rules
- Pay attention to first-time changes or unusual patterns
- Consider both change-level and resource-level insights
- Review custom signals for team-specific context
For Platform Teams
Setup:
- Configure GitHub Action integration for automatic PR analysis
- Set up appropriate midpoint thresholds for your deployment frequency
- Train teams on interpreting Signals output
Monitoring:
- Review Signals configuration periodically
- Adjust sensitivity based on false positive/negative rates
- Use historical analysis to refine thresholds
- Track custom signal effectiveness and team adoption
Interpreting Results
When Signals analysis appears in your PR:
- Check Overall Confidence: Green indicates routine changes, red suggests careful review needed
- Review Risk Alerts: Pay attention to any highlighted exceptional changes
- Use Detail Link: Access full analysis for complex changes
- Make Informed Decisions: Combine Signals insights with your team's expertise
Next Steps
Once you're familiar with Signals:
- Learn about Custom Signals for team-specific insights
- Explore Terraform workflows for complete integration
- Set up GitHub Action integration for automated analysis
- Review change analysis processes for comprehensive understanding
For additional help, visit our support documentation or join our Discord community.